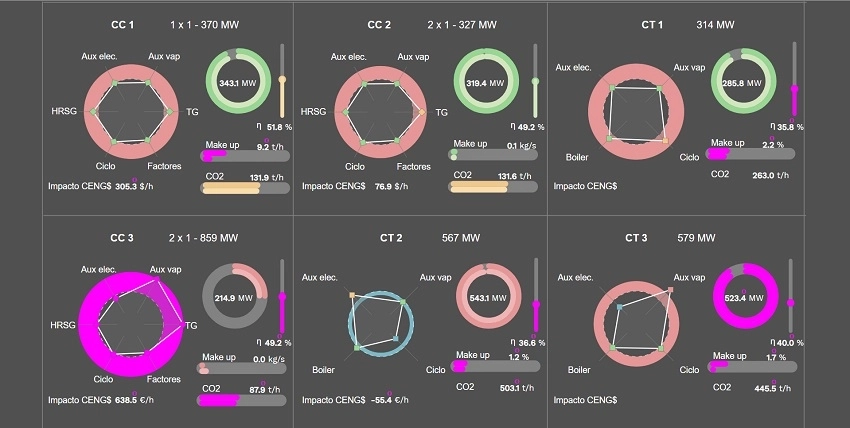
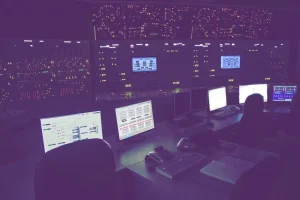
The information that is displayed in current control rooms from a great variety of industries, in monitoring centers, and in results reporting is representative of a «classic» form – based on digital indicators and trend graphs. But… what if that information could be shown graphically and synthetically so that –at just a single glance– we could identify if everything is working as planned or if there is some type of discrepancy? In this way, we would be able to speed up the identification of potential problems and add huge value when it comes to making decisions.
What are smart interfaces and high-performance displays?
The main aim of this new concept for interfacing is the early visual identification of events, as well as support to decision making, thus decreasing the cognitive load on the user, who can be either a control room operator, a field operator, a plant manager, or a fleet manager.
By means of information integration and pattern recognition (such as geometric shapes, colors, etc.), it is possible for the person observing the interface to quickly understand what is happening in the plant at a single glance.
Human Factors Engineering
Human Factors Engineering is a discipline that aims to reduce human error through the design of an optimized man/machine interface. To achieve this, Tecnatom uses a methodology based on NUREG-711 task analysis for the design of interfaces. In recent years, however, this methodology has been complemented by a new, innovative concept in which the limits, constants, parameters, and relationships that govern the system are discovered through analysis of the work environment.
One of the great advantages is that this analysis focuses on who the final recipient of said interface is and what the goals are – instead of focusing on the activities that must be performed. In this way, the interfaces are adequate for both predictable scenarios and unexpected events.
The data obtained from the field is processed in order to show the most adequate information on the displays and to add more value for the individuals who must analyze said information. Tecnatom has developed a new tool for this purpose called TecOS SUPERVISE.
What can TecOS SUPERVISE be applied to?
TecOS SUPERVISE can be applied to any process in industrial plants – whether they are electricity generation technologies or technologies from other sectors. In addition, it can be applied to any profile because there is a methodology behind this new concept in which certain objectives are defined depending upon who the end user is.
A plant manager’s objectives are not the same as those of a control room operator or a fleet manager. Thus, the information shown on the displays has no reason to be the same for all of them.
Likewise, not only is what information is displayed a determining factor, but also the way in which that information is represented to the different users. Therefore, TecOS SUPERVISE also has new ways of representing information to help to improve data analysis. The tool implements a number of graphic resources –Tec-Icons– which provide synthetic and intuitive information for the different information levels.
Tecnatom and the Smart Interface
Currently, Tecnatom is applying this innovative interface concept to all the products it is developing. Solutions such as our new monitoring center, our performance application (TecOS SOLCEP), and our application to supervise power plant startups (TecOS START) are adopting TecOS SUPERVISE in order to improve the user experience by increasing operational efficiency and adding value to the decision-making process in plants.


